Eyes in the Sky,
Hands in the Soil
IAGRO SAT provides the intelligence. Farmers provide the knowledge. Together: precision agriculture at Caribbean scale.
Originally developed for Brazilian agriculture (18M+ properties, 850M ha) — the Caribbean arm launched first because the idle land crisis demanded urgent action. Brazil is a CDB non-borrowing member, enabling South-South technology transfer.
Four Pillars of Satellite Intelligence
All satellite data is open-access under ESA Copernicus. The technology barrier — machine learning, cloud compute, agricultural expertise — is where IAGRO SAT provides value.
Sentinel-2 L2A
Multispectral optical imagery at 10-metre resolution with a 5-day revisit cycle. 13 spectral bands covering visible, near-infrared, and shortwave infrared. Open-access under the Copernicus programme.
Sentinel-1 SAR
Synthetic Aperture Radar that sees through clouds, day or night. Critical during hurricane season when optical imagery is blocked by persistent cloud cover. C-band dual polarization.
ESA WorldCover v200
Global land cover classification at 10-metre resolution. 9 land cover classes including cropland, grassland, tree cover, and built-up areas. Used as the baseline for idle land identification.
Google Earth Engine
Planetary-scale geospatial analysis platform. Processes petabytes of satellite data without downloading a single file. 1,000+ EECU-hours/month for research — IAGRO SAT extends this with production-grade Caribbean ML models.
Sentinel-1 and Sentinel-2 are funded by the European Commission under the Copernicus Earth Observation Programme. All imagery is open-access. However, turning raw satellite pixels into actionable agricultural intelligence requires significant investment in cloud computing, machine learning model development, and domain expertise. This is the technology barrier that keeps satellite-based agriculture out of reach for Caribbean smallholders. IAGRO SAT breaks this barrier — delivering enterprise-grade precision agriculture at less than half the cost of traditional monitoring.
Real Data from Barbados
These images are not mockups. They are computed from real Sentinel-2 and ESA WorldCover data for Barbados.
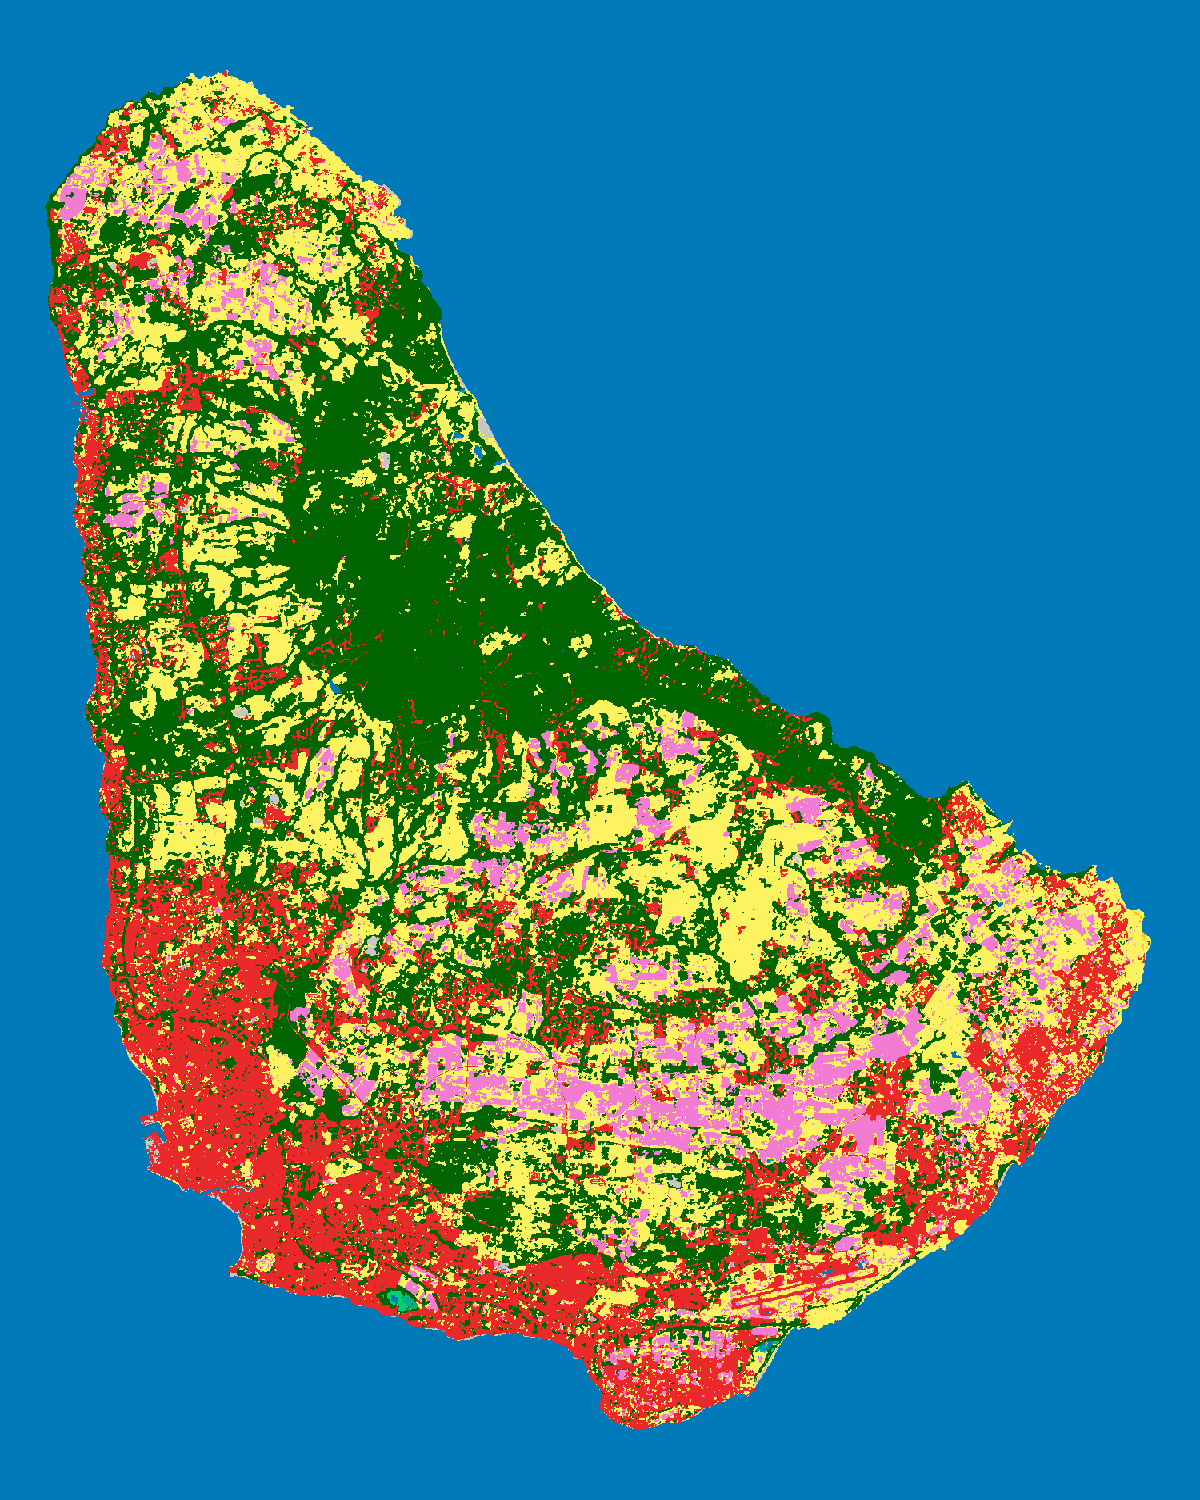
9 land cover classes at 10m resolution. Grassland (amber) represents idle agricultural land — 13,468 hectares identified for activation.
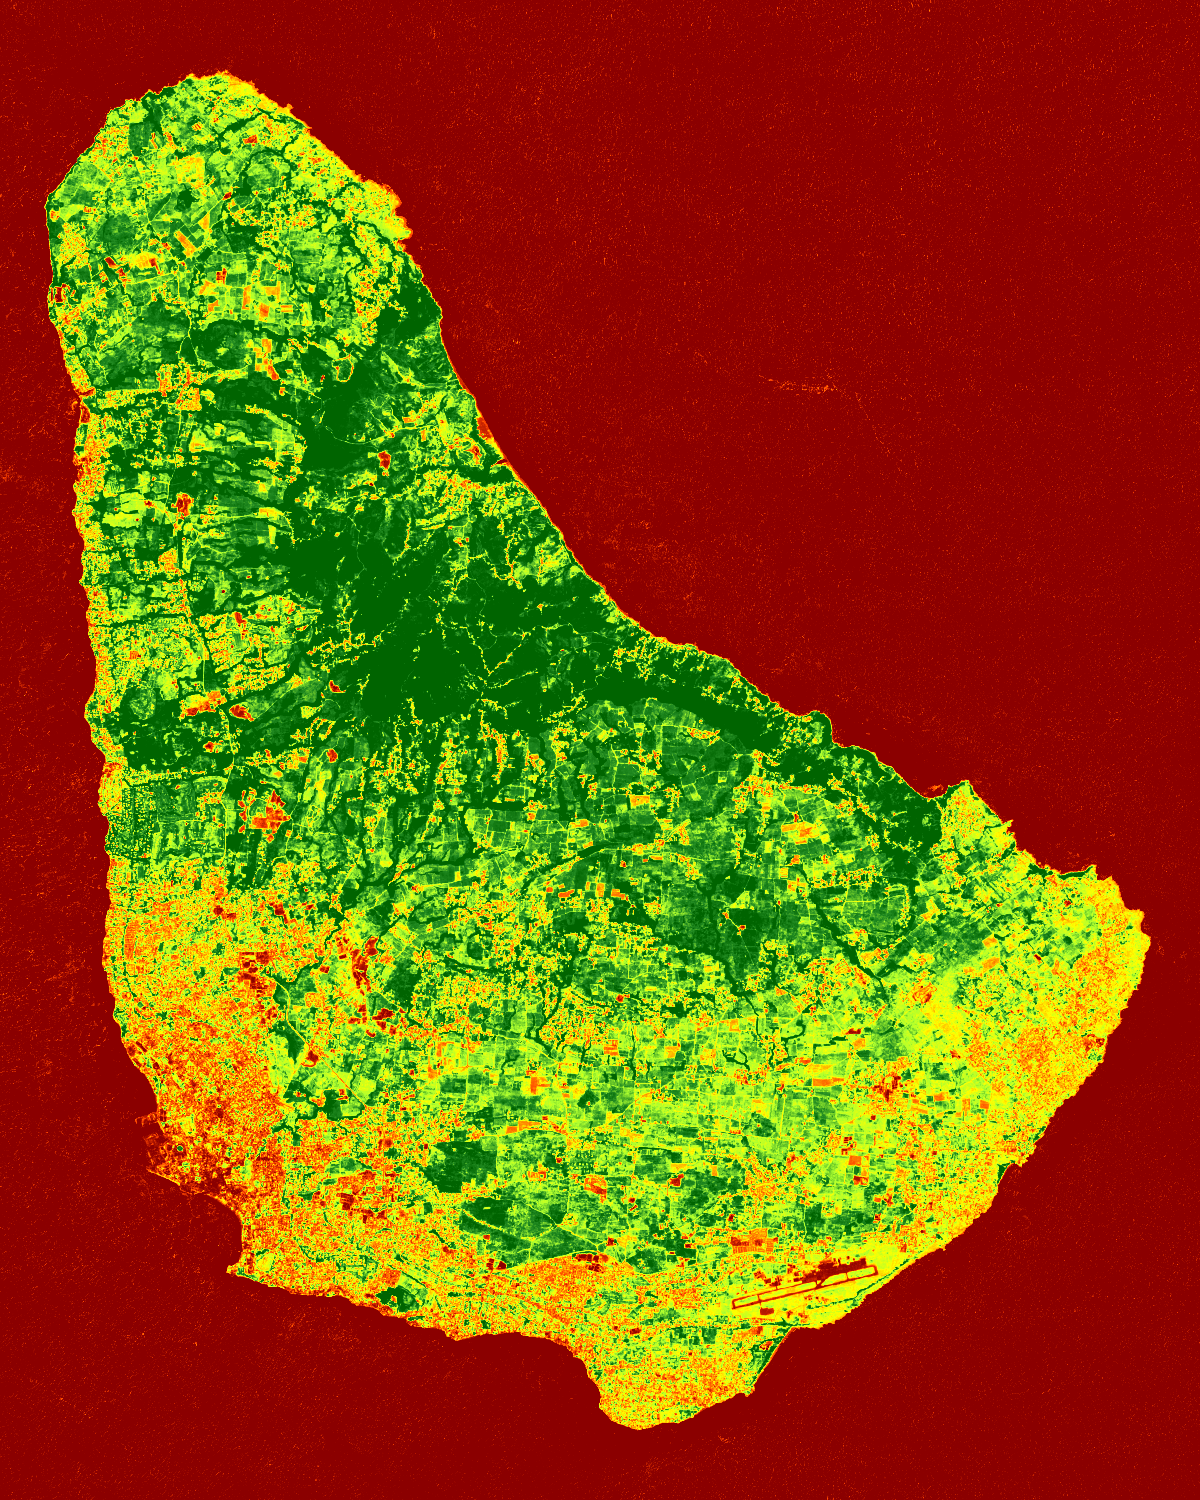
NDVI (Normalized Difference Vegetation Index) computed from 55 cloud-free Sentinel-2 scenes, January to June 2024. Mean NDVI: 0.579.

Continuous monitoring over time reveals seasonal patterns, drought events, and the impact of interventions. Every 5 days, a new Sentinel-2 pass updates the picture.
From Satellite Data to Farmer Action
Not just monitoring — a complete intelligence system that turns satellite data into decisions, backed by training and education to do it right.
Monthly Crop Health
NDVI, EVI, and SAVI vegetation indices computed per-field from Sentinel-2 imagery. Fields classified into health tiers: vigorous, moderate, stressed, or failing. Monthly reports delivered to farmers and cooperatives.
Pest & Disease Early Warning
Spectral anomaly detection identifies stress patterns weeks before they are visible to the human eye. Red-edge and SWIR bands distinguish water stress from nutrient deficiency from pest damage.
Irrigation Optimization
Soil moisture estimation using the Normalized Difference Moisture Index (NDMI) from Sentinel-2. Water stress alerts trigger when moisture drops below crop-specific thresholds.
Yield Forecasting
Pre-harvest yield models trained on historical NDVI time series and harvest data. Predicts tonnage per field 4-8 weeks before harvest. Enables better logistics and market planning.
Hurricane Damage Assessment
Pre/post storm comparison using SAR radar within 48 hours of landfall. Detects flooding, defoliation, and structural damage. Damage maps delivered to CDEMA and national emergency agencies.
Annual Land Use Report
Year-over-year change detection tracking land cover transitions. Identifies abandoned farmland returning to cultivation, urban encroachment on agricultural land, and reforestation progress.
Not Just Data — Education to Do It Right
IAGRO SAT includes a complete 4-module agricultural training programme built to FAO, CIFOR-ICRAF, and Verra standards. Agroforestry, food crops, pasture management, and protected agriculture — each module with Caribbean-specific crop guides, zero-pesticide protocols, and certification pathways. Intelligence without education is just numbers on a screen.
From Raw Pixels to Farmer Alerts
Six stages transform raw satellite imagery into actionable intelligence delivered to the field.
Less Than Half the Cost — Because the Barrier Should Not Be Price
Traditional precision agriculture costs $150-500/ha/yr. IAGRO SAT delivers the same intelligence for less than half, because we built on open satellite data instead of proprietary systems.
The Technology Barrier Has Been Broken
Satellite data is open. But turning it into actionable intelligence requires ML, cloud compute, and Caribbean-specific agricultural expertise.
Satellite data is open. But processing it into actionable intelligence requires machine learning, agricultural science, and Caribbean-specific expertise. IAGRO SAT has already built this — the proof is in the 15-nation census, 8 country evidence packages, and 4-module training programme that already exist.
This Is Not a Concept — It Already Exists
Every claim is backed by real satellite imagery, reproducible computation, and expert-verified research across 15 Caribbean nations. 8 country evidence packages. 4 training modules. 459,500 hectares mapped parcel by parcel.